hero image

What Is Water Treatment Equipment and How Does It Work?

Water treatment equipment turns uncertain water quality into a controlled, measurable process. It can remove sediment, metals, chemicals, microorganisms, or excess minerals. The correct equipment depends on the water source, test results, flow rate, and intended use.

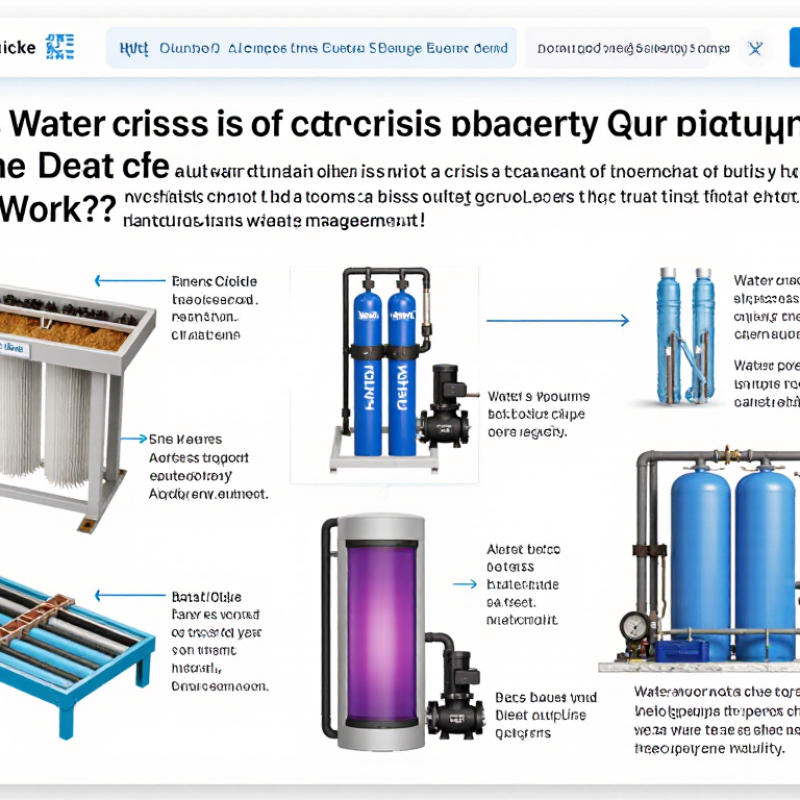
A typical system may begin with a screen or sediment filter. It catches sand, rust, and visible particles. Activated carbon can reduce chlorine, odors, and some organic compounds. Reverse osmosis pushes water through a membrane under pressure, leaving many dissolved salts behind. Ultraviolet units then use light to damage microorganisms. Pumps, pressure gauges, valves, and monitoring sensors keep each stage working safely.

Small details matter. A clogged filter raises pressure. A damaged membrane wastes water. A dirty ultraviolet sleeve can weaken disinfection. These problems are easy to overlook.

Peter Gleick, a respected water scientist, has said, “The world’s water crisis is not a crisis of scarcity, but a crisis of management.” His observation applies directly to Water Treatment Equipment. Good treatment is not simply about buying powerful machinery. It requires sampling, proper sizing, routine maintenance, and trained decisions.

The process is practical, but not perfect.

Water quality can change after rainfall, industrial activity, or seasonal shifts. A system that worked well last year may need adjustment today. Even impressive equipment cannot correct poor testing or neglected maintenance. This guide explains how major treatment technologies work, where they fit, and what operators should check before trusting the final water quality.
What Is Water Treatment Equipment and How Does It Work?

Water Treatment Equipment: Definition, Uses, and Process Categories

What Is Water Treatment Equipment and How Does It Work?

Water treatment equipment removes, reduces, or controls unwanted substances in water. Its purpose depends on the source and intended use. Drinking water systems target pathogens, turbidity, metals, and chemical contaminants. Industrial systems may also control hardness, dissolved salts, and process residues.

The WHO and UNICEF Joint Monitoring Programme reported that 2.2 billion people lacked safely managed drinking water services in 2022. That figure shows why reliable treatment equipment matters beyond factory walls.

Treatment processes usually fall into three categories: physical, chemical, and biological.

Screens and sedimentation tanks remove larger particles. Filters capture finer solids, while membranes separate dissolved contaminants through pressure.

Disinfection uses methods such as ultraviolet light, ozone, or carefully controlled chemicals.

Biological units allow microorganisms to break down organic matter in wastewater.

The United Nations World Water Development Report 2024 states that agriculture accounts for about 70% of global freshwater withdrawals, increasing demand for efficient reuse systems.

Performance depends on testing, maintenance, and correct process selection. A clear outlet does not always mean safe water. That is an easy mistake. Operators should monitor flow, pressure, turbidity, pH, and disinfectant residuals.

The U.S. Environmental Protection Agency notes that treatment goals must reflect local water quality and regulatory requirements.

Equipment can fail through fouled membranes, exhausted media, or poor calibration. Some designs look efficient on paper but perform poorly under seasonal changes. Good engineering leaves room for inspection, adjustment, and uncomfortable questions.

Pretreatment Equipment: Screens with 2–5 mm Bar Spacing Remove Debris

Pretreatment screens are the wastewater plant’s first physical defense. A 2–5 mm bar spacing catches rags, leaves, hair, packaging fragments, and larger plastic pieces before they reach pumps or biological tanks. The U.S. Environmental Protection Agency’s Wastewater Technology Fact Sheet on Screening and Grit Removal places fine-screen openings broadly around 1.5–6 mm. This makes the 2–5 mm range practical for removing small debris without creating excessive resistance.

Operators must control flow speed carefully. Water should pass through the bars steadily, not surge like a blocked drain. Excessive velocity can push debris through the openings. Low velocity can settle grit near the screen channel. EPA guidance also emphasizes regular screenings removal and proper handling because captured material can quickly produce odors and attract insects. In field inspections, a rising water level upstream often signals fouling. A simple rake inspection can reveal more than a remote dashboard.

Bar spacing alone does not guarantee protection. Screen thickness, channel geometry, cleaning frequency, and debris characteristics also affect performance. For example, wet wipes may fold and pass through a 3 mm gap, despite appearing too large. That is an important design weakness. The Water Environment Federation’s process design guidance recommends evaluating peak flow, headloss, and maintenance access together. Engineers should test actual influent conditions, not rely only on catalog measurements.

Pretreatment Equipment: Bar Screen Spacing and Nominal Debris Interception

Bar screens with 2–5 mm spacing are used in pretreatment to intercept coarse debris. The values show the nominal opening width; actual capture depends on debris shape, orientation, screen condition, and flow velocity. Smaller spacing generally retains smaller debris.

Coagulation and Sedimentation: Turning Colloids into Settleable Flocs

Water treatment equipment uses coagulation and sedimentation to remove particles that filters cannot easily capture. Clay, organic matter, and microbes may remain suspended as tiny colloids. Their electrical charges keep them apart. A coagulant reduces that repulsion, allowing particles to collide during rapid mixing. Gentle flocculation then builds soft, visible clusters called flocs.

The change is easy to observe. A cloudy jar can produce brownish flakes within minutes. Operators use jar tests to adjust dosage, pH, mixing speed, and contact time before full-scale operation. Overdosing can restabilize particles and increase sludge. That detail is often underestimated. The World Health Organization’s Guidelines for Drinking-water Quality recommends turbidity below 1 nephelometric turbidity unit before disinfection, with lower levels preferred. The U.S. Environmental Protection Agency’s Water Treatability Database documents coagulation and sedimentation as established processes for reducing turbidity, natural organic matter, and certain microorganisms.

In a settling basin, heavier flocs descend into a sludge layer. Inclined plates can shorten the settling path and improve equipment efficiency. Actual performance varies with temperature, alkalinity, raw-water chemistry, and particle size. Cold water slows floc growth. High organic content may consume more coagulant. Operators therefore monitor settled-water turbidity continuously, not only during scheduled sampling. The process is reliable, but never automatic. A clear jar test can still mislead when plant conditions change.

What Is Water Treatment Equipment and How Does It Work? — Coagulation and Sedimentation: Turning Colloids into Settleable Flocs

Typical design and operating considerations for conventional coagulation–flocculation–sedimentation systems. Actual values depend on raw-water quality, jar testing, temperature, and local treatment requirements.

Process or Equipment Primary Function Typical Operating Range or Data What Happens in the Water Key Monitoring Indicators
Raw-Water Intake and Screening Removes large debris before chemical treatment and clarification. Bar-screen openings commonly range from approximately 6 to 50 mm, depending on the intake design. Leaves suspended particles and colloids in the water while retaining larger solids such as leaves and plastics. Screen differential head, flow rate, debris loading, and intake water level.
Rapid Mixing Disperses coagulant quickly and uniformly throughout the water. Typical mixing time: about 10–60 seconds. Common velocity-gradient values are approximately 300–1,000 s−1. Coagulant hydrolysis products neutralize particle charges and may form metal hydroxide precipitates that capture impurities. pH, temperature, chemical dose, mixer speed, and mixing intensity.
Coagulant Addition Destabilizes colloids that would otherwise remain suspended. Common coagulant categories include aluminum salts, iron salts, and polymer-based aids. Dose must be established by jar testing; it is not a universal fixed value. Reduces electrostatic repulsion and promotes particle collisions, aggregation, and adsorption. Coagulant dose, alkalinity, pH, turbidity, dissolved organic carbon, and residual metal concentration.
Flocculation Basin Gently brings destabilized particles together to form larger flocs. Typical detention time: about 15–45 minutes. Common velocity-gradient values are approximately 20–80 s−1, often reduced through multiple stages. Small microflocs collide and grow into stronger, settleable flocs without excessive shear. Floc size, floc strength, basin short-circuiting, paddle speed, and visible carryover.
Flocculation Equipment Provides controlled low-energy mixing using mechanical or hydraulic methods. Common equipment includes horizontal or vertical paddles, turbine mixers, baffled channels, and hydraulic flocculators. Maintains particle contact while limiting turbulence that could break formed flocs apart. Motor speed, power draw, impeller condition, baffle condition, and floc-breakage signs.
Sedimentation Basin Separates settleable flocs from clarified water by gravity. Typical surface overflow rates for conventional clarification are approximately 20–60 m³/m²·day, subject to design and water quality. Flocs settle to the basin floor, while clarified water flows toward collection launders or outlet structures. Overflow rate, basin water level, turbidity, sludge blanket depth, and hydraulic short-circuiting.
Settling Time Provides sufficient hydraulic residence time for flocs to separate. Common detention times are approximately 2–4 hours in conventional sedimentation basins. Gravity overcomes the upward or horizontal water movement for particles with adequate settling velocity. Detention time, inlet and outlet flow distribution, temperature, and settled-water turbidity.
Tube or Plate Settlers Increase effective settling area within a compact clarification footprint. Inclined modules commonly use angles near 60° from horizontal, although the exact arrangement varies by design. Shortens the vertical settling distance and encourages captured solids to slide down into the sludge zone. Module fouling, hydraulic loading, channel distribution, and effluent turbidity.
Sludge Collection and Removal Continuously or periodically removes concentrated solids from the basin. Equipment may include scraper bridges, chain-and-flight collectors, suction headers, or hopper outlets. Prevents excessive sludge accumulation, anaerobic conditions, and resuspension of settled flocs. Sludge blanket depth, solids concentration, withdrawal frequency, torque, and odor formation.
Clarified-Water Outlet Collects treated water evenly while minimizing disturbance to the settling zone. Outlet launders and weirs are designed to distribute flow uniformly across the basin width. Allows low-turbidity water to leave the sedimentation stage for filtration or other downstream treatment. Effluent turbidity, weir loading, flow balance, floating solids, and visible floc carryover.
Typical Performance Indicators Evaluates whether coagulation and sedimentation are functioning effectively. Performance is site-specific; turbidity reduction, particle removal, and settled-water quality are normally verified through routine sampling. Successful treatment converts stable colloids into larger flocs that can be removed by gravity. Raw and settled-water turbidity, pH, alkalinity, temperature, coagulant dose, and jar-test results.

Note: Operating ranges are representative engineering values rather than universal requirements. Chemical selection and dosage should be confirmed by jar testing, pilot testing, process monitoring, and applicable drinking-water or wastewater regulations.

Membrane Equipment: RO Rejects About 95–99% of Dissolved Salts

What Is Water Treatment Equipment and How Does It Work?

Membrane equipment uses pressure to separate water from dissolved substances. Reverse osmosis, or RO, pushes feedwater through a semi-permeable membrane. Water molecules pass through. Most dissolved salts remain behind.

RO commonly rejects about 95–99% of dissolved salts when properly designed and operated. The U.S. Environmental Protection Agency reports that RO can remove more than 90% of many inorganic contaminants. The World Health Organization also identifies membrane treatment as an effective method for reducing salinity and several chemical contaminants. These figures are not automatic promises. Feedwater temperature, pressure, pH, scaling, and membrane age strongly affect performance.

Two streams leave the system: permeate and concentrate.

Permeate becomes the treated water. Concentrate carries the rejected salts away.

A practical plant may recover 50–85% of feedwater, depending on water quality and equipment design, according to engineering data from the International Desalination Association. The remaining stream can be surprisingly salty.

Maintenance decides whether laboratory performance survives daily use.

Operators check conductivity, pressure differences, and flow rates. A sudden conductivity increase may signal membrane damage. Fouling can also develop slowly, like a thin invisible film on the surface. Pretreatment filters, correct cleaning intervals, and careful monitoring matter. Numbers can look impressive. Real water is less cooperative.

Disinfection and Controls: UV at 40 mJ/cm² Plus Residual Monitoring

Water treatment equipment combines physical barriers, sensors, pumps, and control logic to make water safer. For ultraviolet disinfection, a 40 mJ/cm² dose is a common design benchmark. The U.S. EPA’s Ultraviolet Disinfection Guidance Manual links validated UV performance with pathogen reduction targets, including Cryptosporidium and Giardia. However, dose depends on flow, UV transmittance, lamp output, and reactor condition. It is not a magic shield.

A reliable system continuously measures UV intensity, flow rate, and water clarity. If UV transmittance falls, the same lamp power may deliver less effective treatment. Controls should trigger alarms, reduce flow, or divert water when the validated dose cannot be maintained. Operators should record these events, not simply reset them. That practical record often reveals fouled quartz sleeves or aging sensors.

UV leaves no protective residual in distribution pipes. The World Health Organization’s Guidelines for Drinking-water Quality therefore describe residual disinfectant monitoring as an important safeguard where secondary contamination is possible. A free-chlorine analyzer can check residual levels at the outlet and farther through the network. Many systems target approximately 0.2 mg/L at delivery, depending on local requirements and water chemistry. Sensors drift. Calibration errors happen. Manual verification remains necessary, especially after maintenance or sudden turbidity changes.